STAY UPDATED
modern web interface
The dashboard panel is accessible through a web-browser. It has been designed using RWD technology so you can manage systemONE using: PC, smartphone or tablet.
notifications
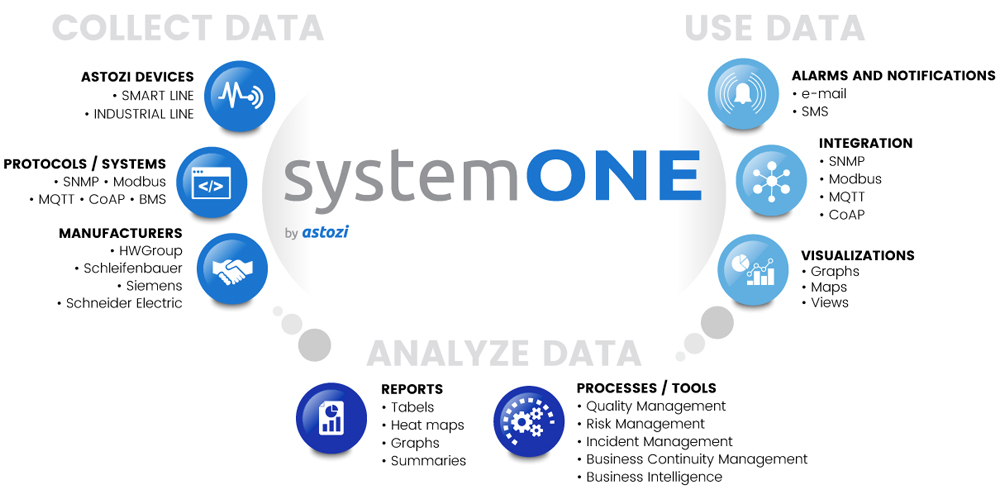
sending information about events and threshold exceedances of using e-mail, SNMP trap, SMS
locations
designed for environmental monitoring of single locations, as well as complex and distributed installations that could spread across many physical locations.
visualization
you can make comprehensive visualization of connected devices and also visualize your measurement data using views and maps.


OPTIMIZE COST
heatmaps
the spatial and timebased heatmaps
graphs
visualize your measurement data using easy configurable graphs and views
energy meters
support for energy measurement with energy meters
PREDICTIVE MAINTENANCE
collecting data
support for many types of devices, manufacturers, protocols, both IT and industrial one
history
access to historical data (measurements, events)
alerts & events
quick access to recent events and alarms

Ask us for more.
Please fill out this form.
A Astozi or our Partner Representative will contact you regarding your interest in astozi solutions.

